Aarhus University Seal

Using video for data visualisation 

Short description

Video is used to support and streamline the following parts of teaching:

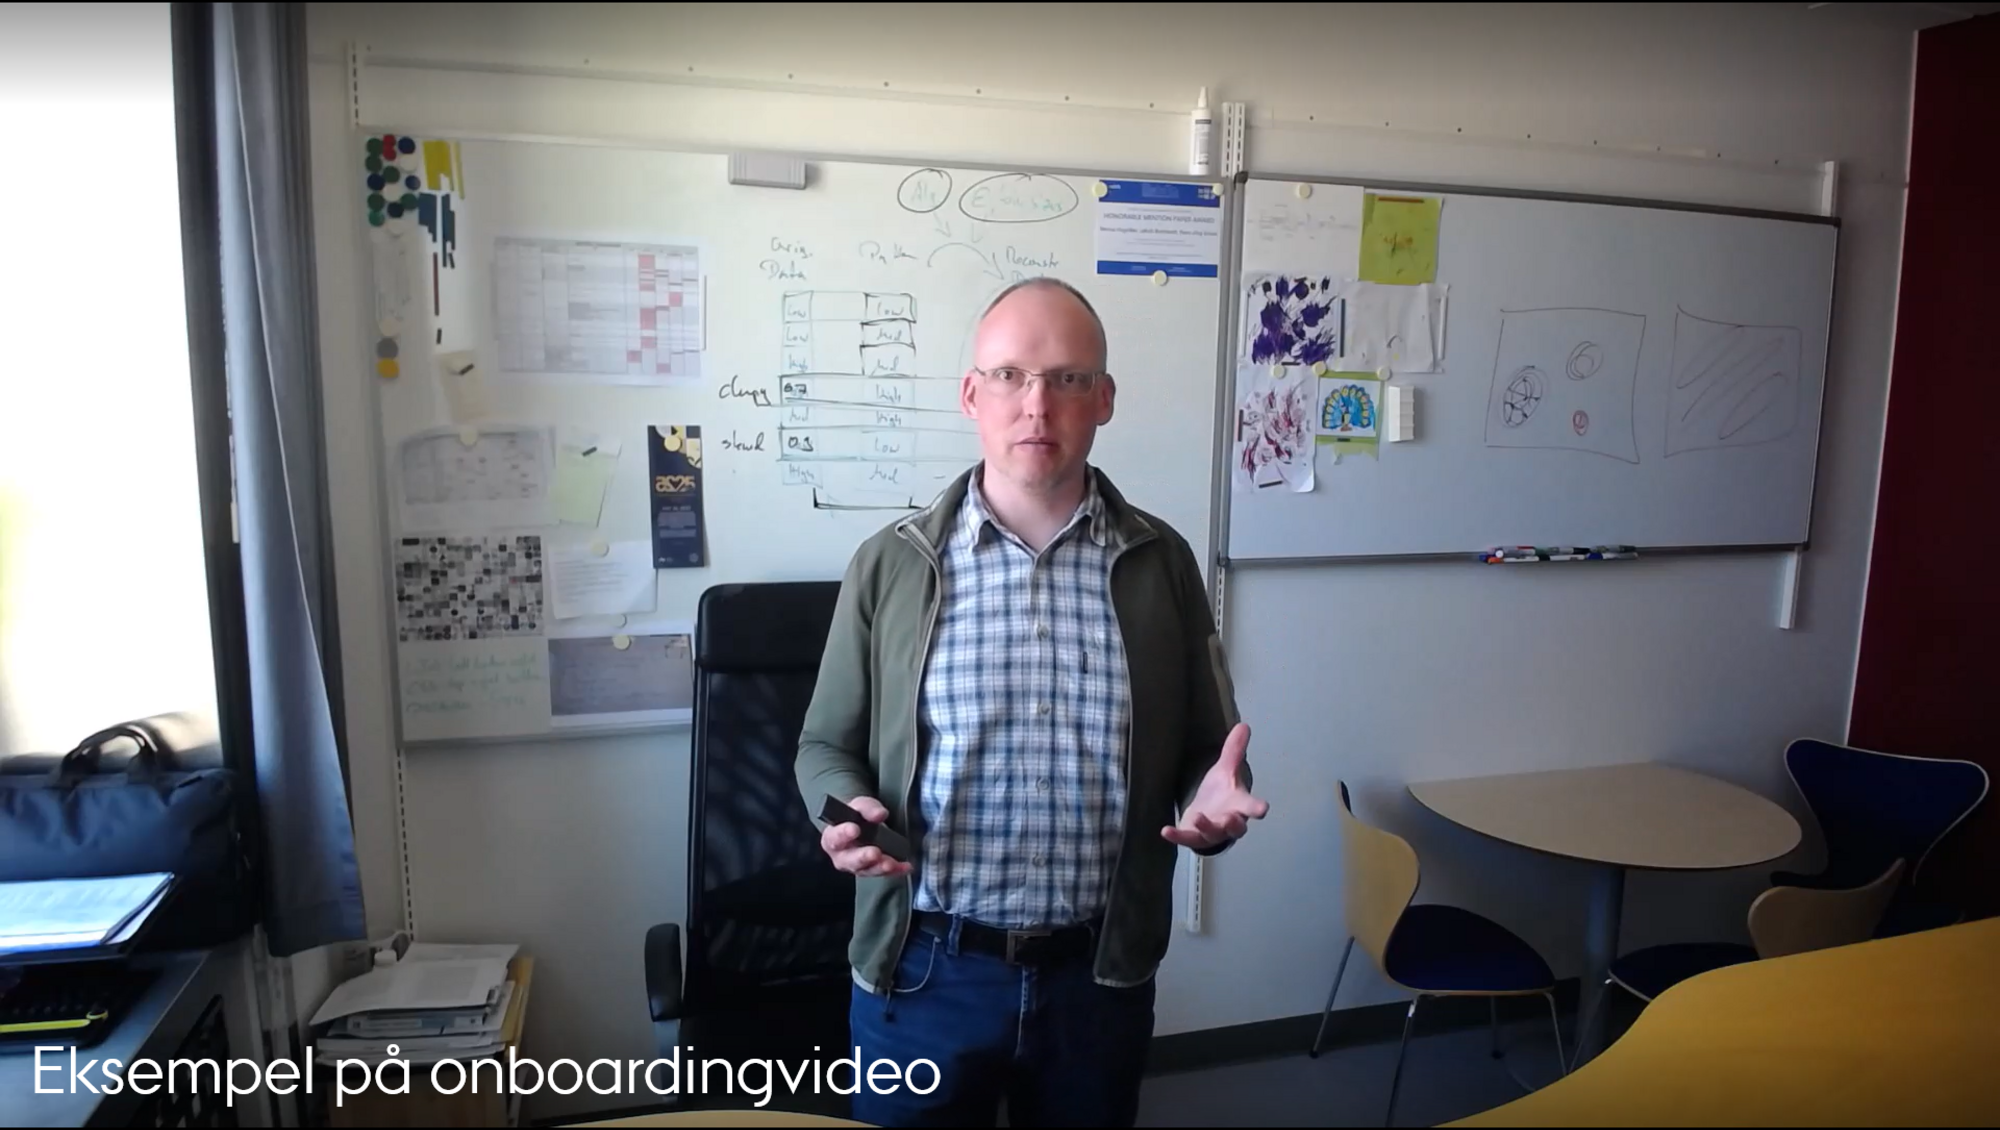
  • Onboarding videos: Instead of sending the students a long email when they signed up for the course, the instructor made a short introductory video.

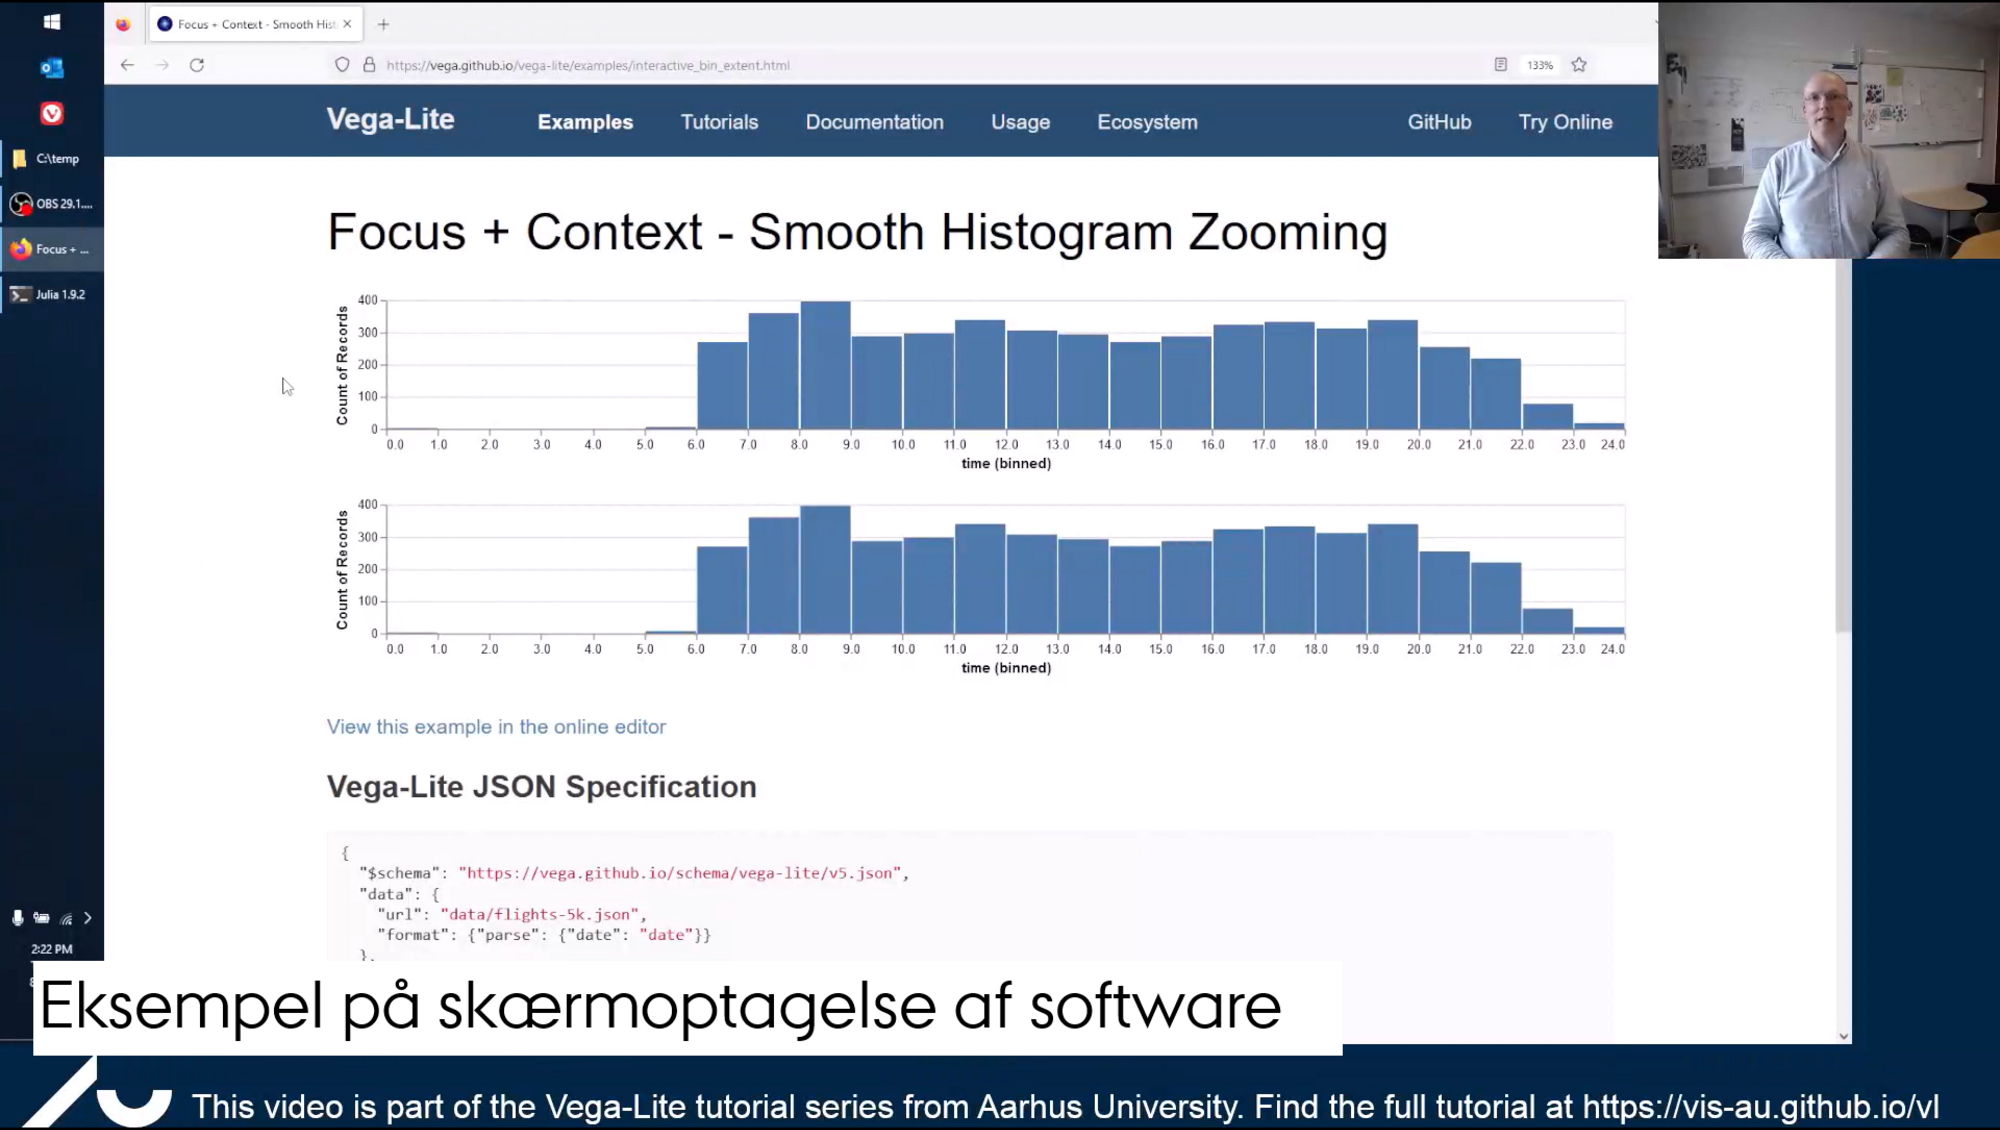
  • Lectures: A mix of video formats was used for lectures, including pre-recorded videos, live streaming and lecture recordings.

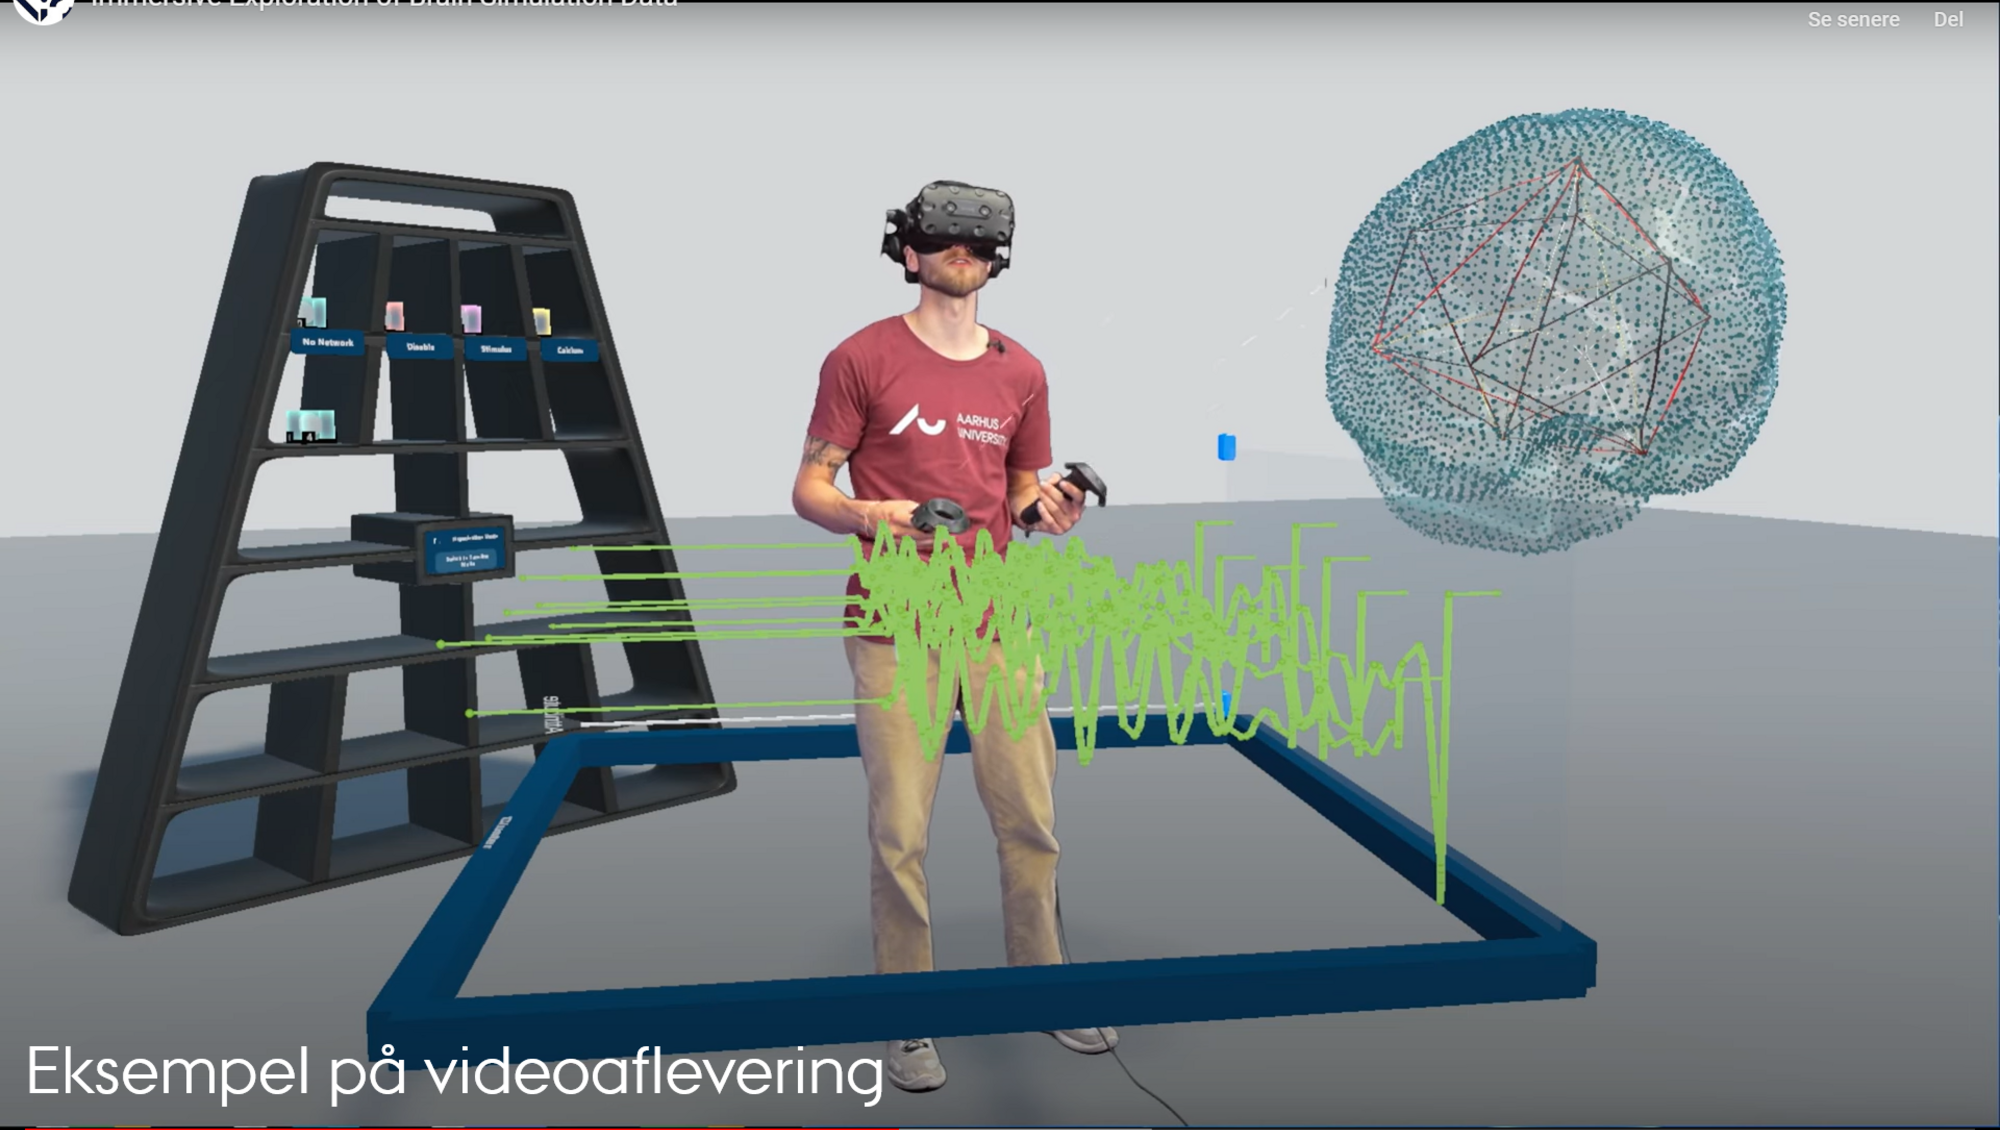
  • Submissions and exams: Video was used for the submission of visual prototypes and for conducting a 'mock up' exam.

Motivation

As the name suggests, data visualisation is a highly visual subject, which places other demands on communicating the teaching content as well as forms of examination. 

Learning objectives

At the end of this course, participants will have gained knowledge of data visualization as: 

  • A method of tightly interlinked graphic design, interaction design, and algorithm design (visualization design). 

  • A computational process that transforms input data into graphic representations (visualization pipeline). 

  • A tool for user-driven data analysis from preparation, via exploration and confirmation, to presentation (visual analytics). 

Execution

THE PROCESS

Onboarding students

Instead of sending the students a long email once they had registered for the course, the teacher made a short introductory video. The video consisted of a brief welcome, as well as an introduction to what the students could expect from the course, content and teaching format, etc. The video filled the gap between course registration and the start of the course, and it answered some of students’ most pressing questions. The video was also shared with students who had not yet decided whether they wanted to follow the course. 

Lectures

For lectures, a mix of video methods was used to describe the teaching material.  

  • For example, pre-recorded videos were used to make screen recordings of software for data visualisation to introduce this to the students.  
  • Third-party material was used to a limited extent, e.g. YouTube videos. Many aspects of data visualisation have not yet been clarified and are still under ongoing debate. Since the teacher had his own opinions about this, he found it necessary to present other opinions to the students.  
  • Live streaming of lectures was carried out via Panopto. This made it possible for students who could not be there in person to follow the teaching from home. 
  • Recordings: The live-streamed lectures were recorded and made available to other faculties and degree programmes. Autogenerated searchable captions were added to the videos in Panopto, so the students could easily search for specific topics in the lectures.  

Video assignments

As part of the course, the students had to develop and submit an interactive visualisation prototype. Since the prototype had to be interactive, a report with a screenshot would not be sufficient. The students therefore recorded a short screen recording in which they demonstrated the prototype. 

Exam

  • All student teachers and teachers recorded a mock exam in which they played the role of a student who was well prepared, poorly prepared, nervous, etc. The video recordings were shared with the students early in the process to give them an idea of how the exam would be carried out and how they should prepare.  
  • Videos can also be used as part of exams. This was especially relevant during Covid when students could submit pre-recorded videos that were included in the overall performance assessment.  
  • At the end of exams, a video was sent to all students summarising general mistakes and challenges observed by the teacher during the exams.  

Reflections

Outcomes

  • Live streaming in Panopto allowed students to attend classes from home.   
  • They recorded the videos, and searchable captions made it easier for the students to prepare for the exam. 
  • By submitting videos, the students could showcase interactive creations and express themselves visually. It also prepared them for the oral exam. 
  • The mock exam prepared the students for the actual exam and made the grading transparent. 
  • Panopto statistics show that the videos had 2000 views and 58000 minutes of streamed content in the autumn semester of 2022. 60% of the streaming took place in the month leading up to the exam, and the remaining 40% was spread over the semester. 

Challenges

  • Students who followed lectures via live streams or recorded videos often felt like "second-class citizens". That is the teacher often failed to notice the chat or forgot to interact with those participating online. 
  • The video submissions were often a long presentation of the features of the prototypes, causing a drop in the academic level. 
  • Producing videos and maintaining the video material is time-consuming. It saves resources in other areas of teaching work, as videos can be reused across courses and degree programmes. 
  • Note that there may be GDPR restrictions on reusing videos in which students are visible. Read more about guidelines for streaming and recording videos at Aarhus University

Advices for other educators

  • The videos – those produced by the teacher as well as those produced by the students – can be used in following semesters to prepare new students for what to expect from the course. 


Basic information

Educator Hans-Jörg Schulz 
Faculty and department NAT – Computer Science 
Degree programme Computer Science 
Level of study Professional Master’s 
Course/subject Data Visualization 
Number of students 80 
Extent Tilføj info fra bidragsskema.
Teaching format Tilføj info fra bidragsskema.
Implementation Tilføj info fra bidragsskema.

Contact

Please contact the editors at AU Educate if you have any questions about the content of the platform or if you need consultation on your teaching from one of the many skilled professionals at the Centre for Educational Development